Data Engineering
NYC Taxi ETL
9.17M+ records, orchestrated end-to-end, and loaded 82% faster.
- NYC taxi records processed
- 9.17M+
- NYC taxi records processed
- PostgreSQL load time (~51 → ~9 min)
- -82%
- PostgreSQL load time (~51 → ~9 min)
- data-quality checks & KPI dashboards
- Automated
- data-quality checks & KPI dashboards
01 Context
NYC Yellow Taxi trip data (Q1 2023) published by the NYC TLC as Parquet files. The goal: a robust, documented and orchestrated end-to-end ETL workflow, built the way a production data team would build it.
02 Problem
Millions of raw trips must be ingested, cleaned and loaded into PostgreSQL reliably and fast. A naive load took ~51 minutes, and without automated checks there is no guarantee the data feeding the KPIs is sound.
03 What I built
- 01
Extract - downloads the NYC TLC Parquet files into a raw zone.
- 02
Transform - cleaning, logical filters, normalisation and de-duplication into a clean zone.
- 03
Load - optimised PostgreSQL loading with chunked multi-row batch inserts, temporal indexes and VACUUM / ANALYZE management.
- 04
Quality checks - automated controls that generate a Markdown quality report.
- 05
Analytics - materialised views, KPI exports and visual summaries.
- 06
Orchestration - the whole pipeline runs as a single Prefect 3 flow.
04 In action
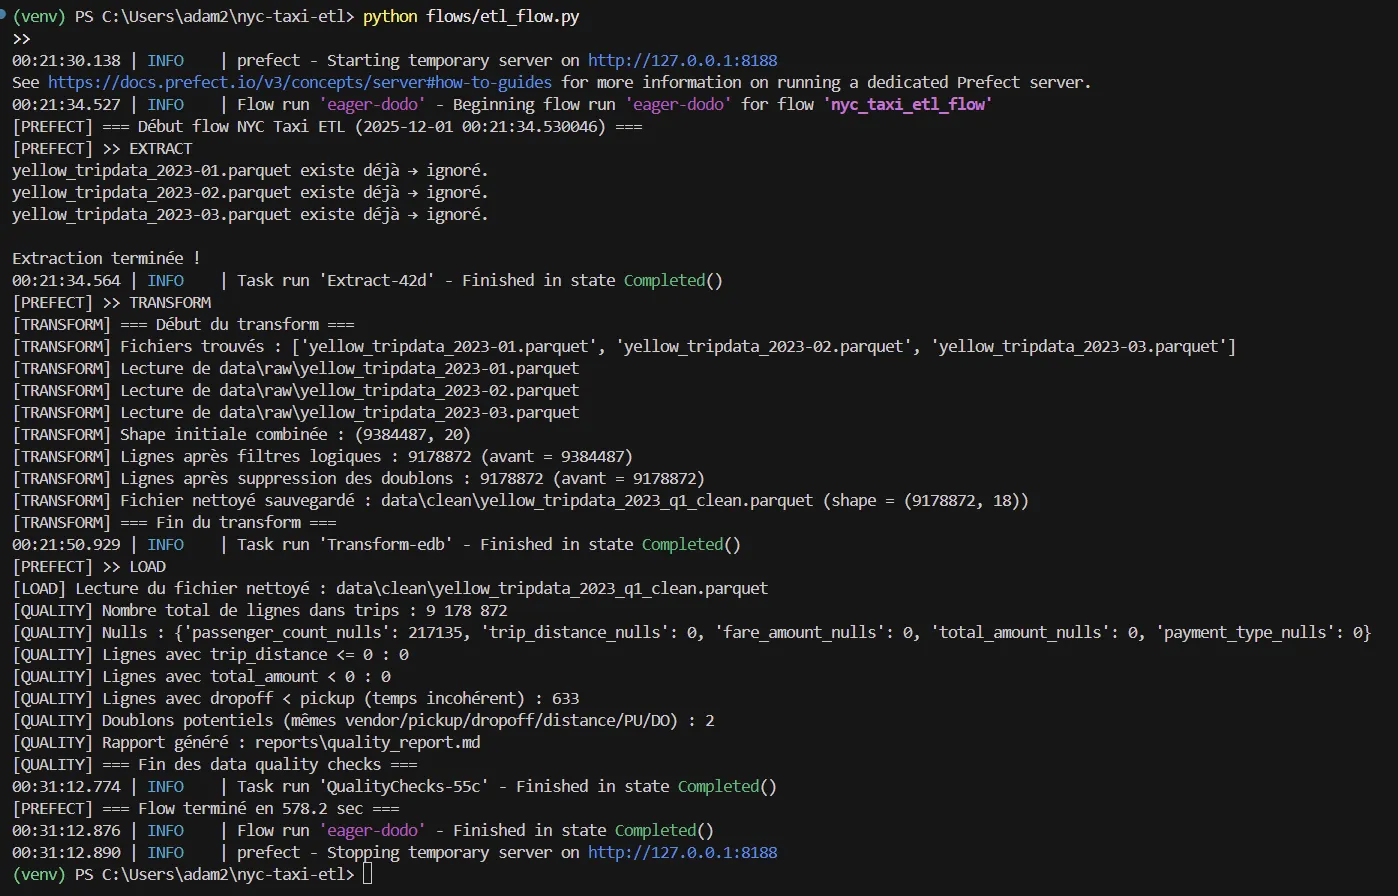
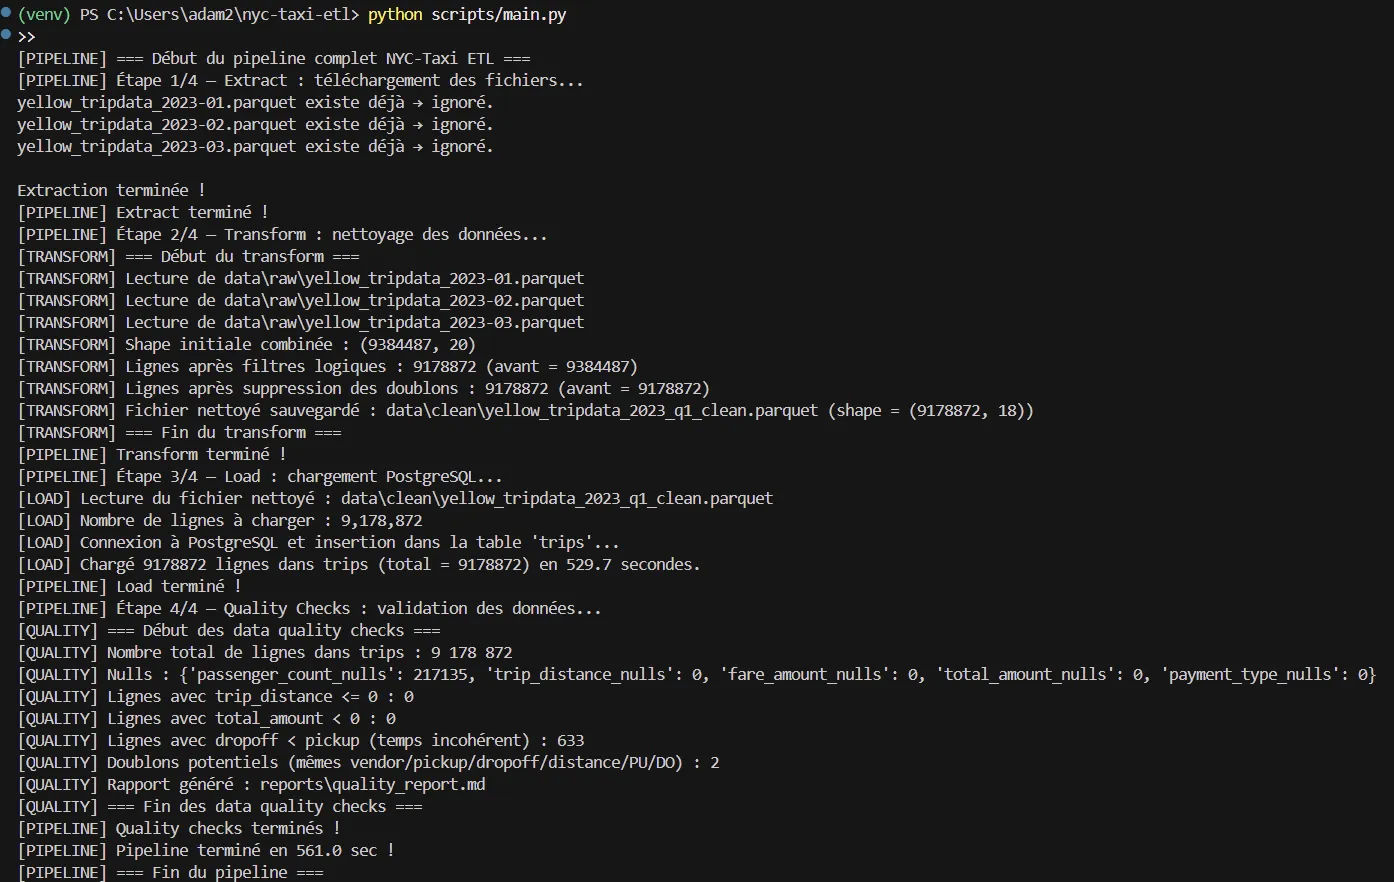
Screenshots from the project repository.
05 Results
- NYC taxi records processed9.17M+
- PostgreSQL load time (~51 → ~9 min)-82%
- data-quality checks & KPI dashboardsAutomated
06 What I learned
- Load performance is a design decision: chunked batch inserts plus index and VACUUM / ANALYZE management turned a ~51-minute load into ~9 minutes.
- Orchestration makes a pipeline observable and re-runnable step by step, instead of a fragile chain of scripts.
- Data-quality checks belong inside the pipeline: a KPI is only as trustworthy as the checks that run before it.
- Materialised views keep heavy analytics away from the raw tables and make dashboards fast.
Next case study
CloudPredict